
Fig. 3. Comparison of mean scPDSI fields in the OWDA during periods associated with the MCA, LIA, and modern period (MOD).
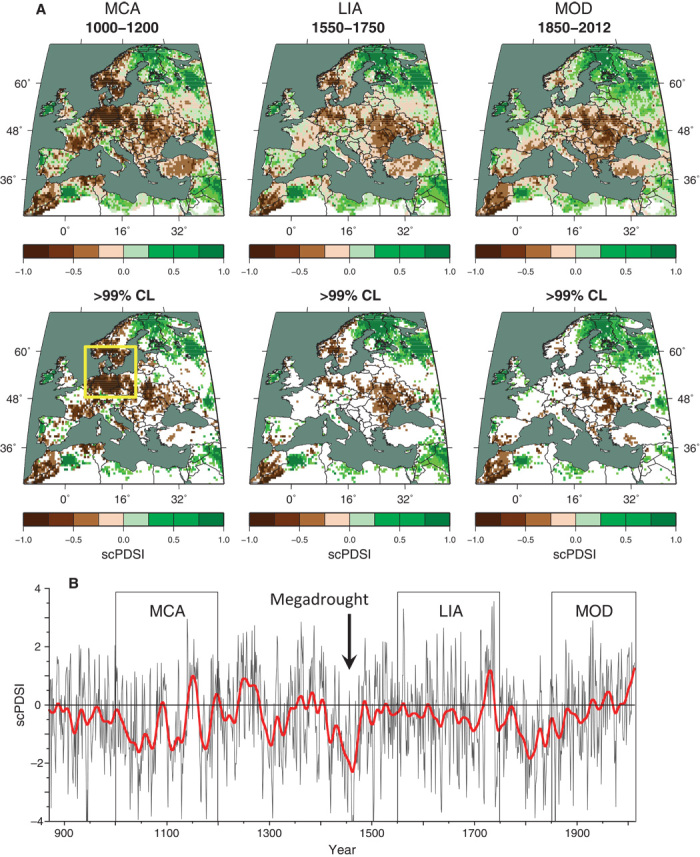
(A) The mean fields were calculated over the time intervals indicated, and the areas in those fields with significant mean anomalies of wetness or dryness (p < 0.01, two-tailed, corrected for lag − 1 autocorrelation) are indicated in the middle set of maps. The area of maximum dryness during the MCA period is indicated by the yellow rectangle in the lower MCA map. (B) Average of OWDA reconstructions from within this rectangle. It confirms the drier conditions during the MCA period and also shows the occurrence of an extraordinary megadrought in the mid-15th century. CL, confidence level.