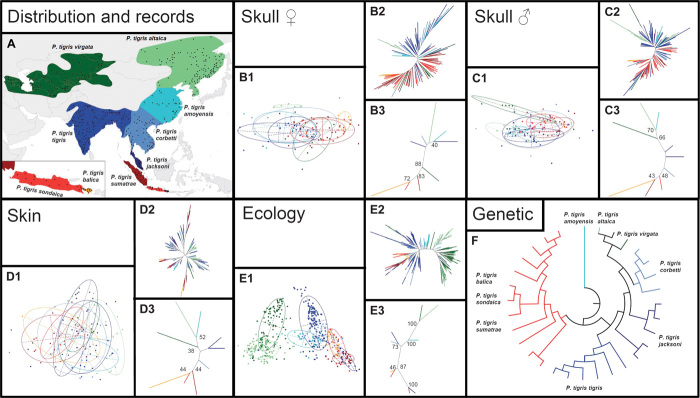
Fig. 1. Variation among and phenotypic space across all nine putative subspecies of tigers.
(A) Former distribution of the nine putative subspecies and occurrence records used for the ecological analysis. (B1 to E3) Multivariate analyses of skull traits [(B1 to B3) females; (C1 to C3) males], pelage (D1 to D3) and ecological preferences (E1 to E3). (B1 to E1) The 1.5 inertia ellipse for all nine putative subspecies displayed on the plane defined by the first two principal components; (B2 to E2) unrooted binary neighbor-joining trees based on the matrices of Euclidean distance between individuals in the multivariate space defined by all principal components; (B3 to E3) same as in (B2 to E2) but with distances being measured between the centroids of each putative subspecies with bootstrap values of groupings. (F) Radial tree of the maximum likelihood analysis of 3968 bp of mtDNA (see Fig. 2).

