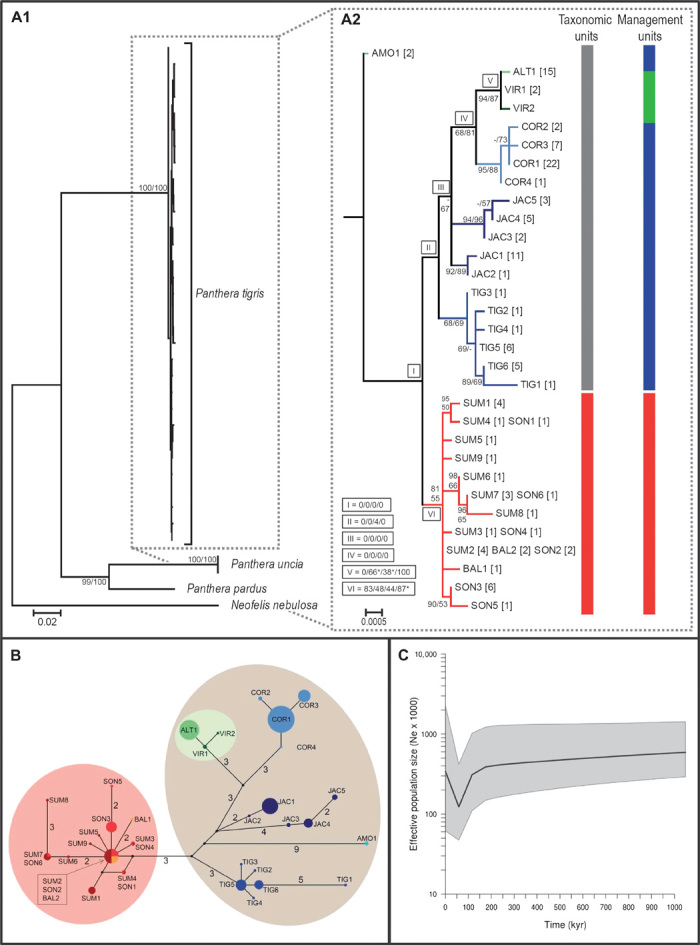
Fig. 2. Phylogenetic analyses of all nine putative subspecies using 3968 bp of mtDNA.

(A1 and A2) Maximum likelihood tree of intraspecific variation among all putative tiger subspecies in relation to three pantherine cat species [snow leopard (Panthera uncia), leopard (Panthera pardus), and clouded leopard (Neofelis nebulosa)]. Values above or below branches show maximum likelihood and Bayesian inference bootstrap supports. (A1) Maximum likelihood tree including three pantherine cat species as outgroups. (A2) Enlargement of the maximum likelihood tree part showing the tigers. Roman numerals indicate bootstrap supports of nodes for skull {females} / skull {males} / skin / ecological preferences. Abbreviations for putative subspecies are given in Table 1. * indicates that one additional putative subspecies clusters with this group. (B) Haplotype network. The size of the circles is proportional to haplotype frequency. Connecting lines between haplotypes represent one mutational step unless indicated otherwise by numbers. (C) Bayesian demographic skyline reconstruction of tigers for the last 1 million years.
