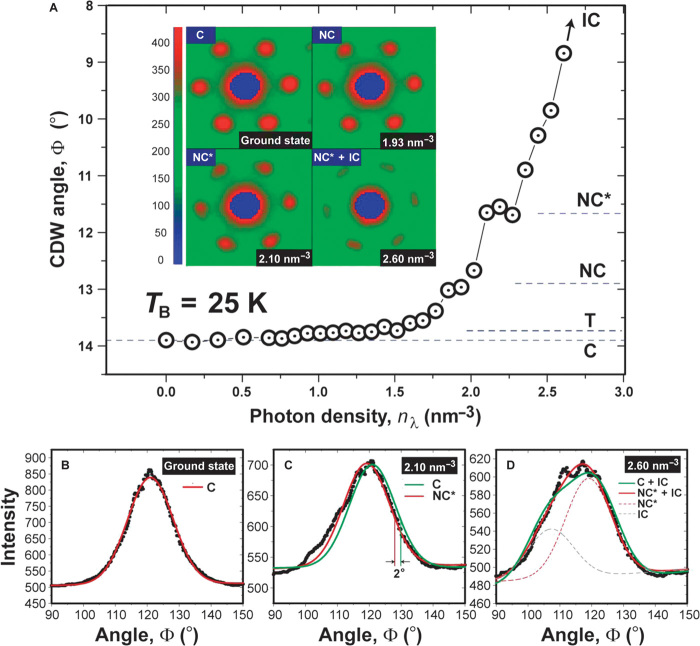
Fig. 3. Evolution of CDW phases in 1T-TaS2 induced by mid-infrared pulses at 25 K.
(A) Optically induced evolution of CDW states characterized by CDW suppression (in ratio, based on unperturbed CDW intensity) and CDW angle Φ at various absorbed photon density at a base temperature TB of 25 K using the 800-nm pump photons. The inset shows the diffraction images of the unpumped (ground state) and excited CDW at the quasi-equilibrium time, +20 ps. The central Bragg peak is masked out to highlight the changes in CDW intensity. (B to D) Angular profiles of the CDW peak at selected pump optical density nλ. At nλ = 2.6 nm−3, the CDW is in a mixed state between NC* and IC. The fit shows the individual components of the IC (dashed gray) and NC* (dashed red) to compose the best fit of the mixed state (solid red), whereas the green curve represents an attempted fit by using the C and IC as the constituent states.

