
Fig. 3. Characterization of antiferromagnetic order with elastic neutron diffraction.
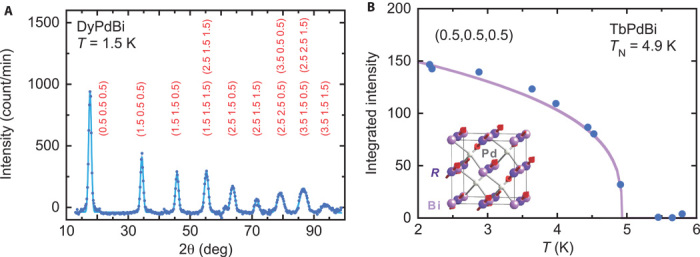
(A) Low-temperature magnetic diffraction pattern of DyPdBi obtained by subtracting 18-K data from 1.5-K data. Labels indicate the series of half-integer antiferromagnetic peaks. deg, degree. (B) Antiferromagnetic order parameter of single-crystal TbPdBi obtained from the intensity of the (0.5,0.5,0.5) magnetic Bragg peak. The solid curve is a mean-field fit to the data, and the inset presents a schematic of the antiferromagnetic spin structure.