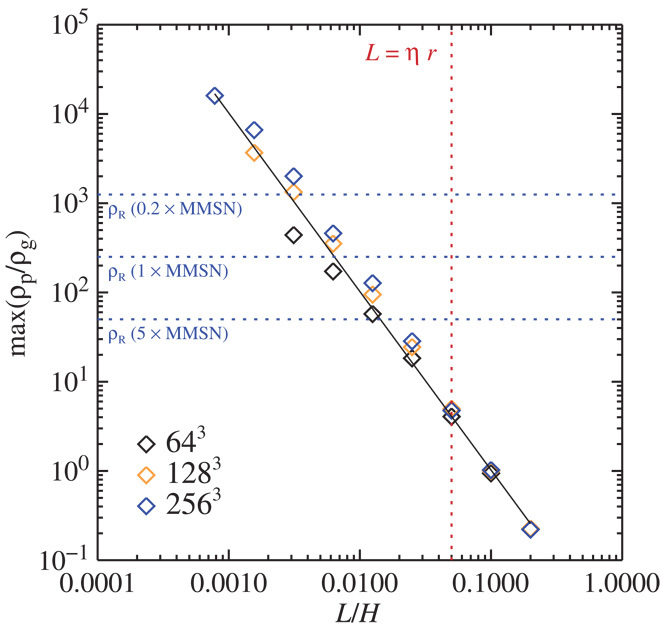
Fig. 2. The maximum particle density versus the length scale (measured in gas scale heights, H).

We have taken spheres with diameters from one grid cell up to the largest scale of the simulation and noted the maximum value of the density over all simulation snapshots. The results are relatively converged on each scale. The increase in maximum particle density with increasing resolution is an effect of resolving ever smaller-scale filaments. Blue dotted lines mark the Roche density at three values of the gas column density at 2.5 AU relative to the minimum mass solar nebula (MMSN). The red dotted line indicates the characteristic length scale of the streaming instability. The black line shows a power law of slope −2, which shows that the maximum density follows approximately the inverse square of the length scale.
