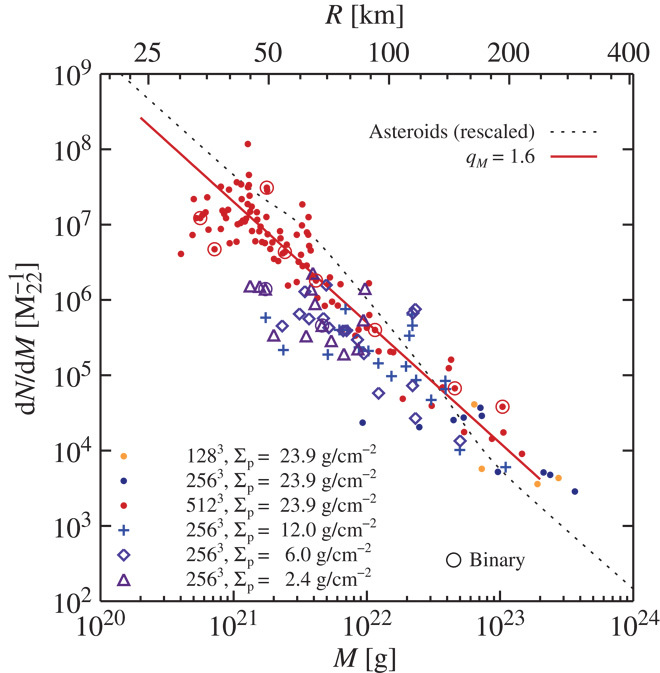
Fig. 3. Birth size distribution of planetesimals forming by the streaming instability in 25-cm-sized particles.

The differential number of planetesimals (per 1022 g) is calculated with respect to the nearest size neighbors in the simulation. Yellow, blue, and red circles indicate individual planetesimals forming in computer simulations at 1283, 2563, and 5123 grid cells, respectively. The size distribution of the highest-resolution simulation is fitted with a power law dN/dM ∝ M−qM (red line; the fit is based on the cumulative size distribution shown in Fig. 4, but does not include the exponential tapering). Simulations with lower values of the particle column density Σp yield successively smaller radii for the largest planetesimals, down to below 100 km in radius for a column density similar to the Minimum Mass Solar Nebula model (Σp = 4.3 g/cm2 at r = 2.5 AU). Binary planetesimals (marked with circles) appear only in the highest-resolution simulation because binary survival requires sufficient resolution of the Hill radius. The differential size distribution of the asteroid belt (dashed line) shows characteristic bumps at 60 and 200 km. The planetesimal birth sizes from the simulations are clearly not in agreement with main belt asteroids.
