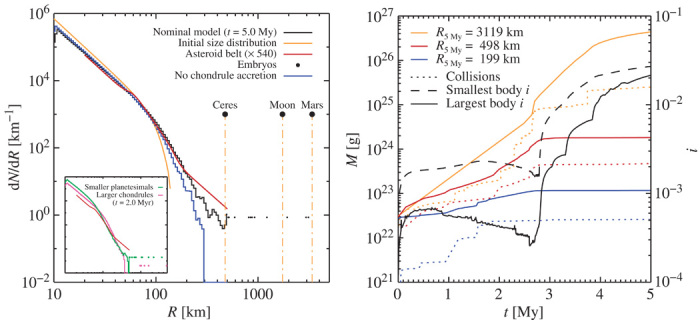
Fig. 5. The size distribution of asteroids and embryos after accreting chondrules for 5 My (left panel) and selected masses and inclinations as a function of time (right panel).

The nominal model (black line) closely matches the steep size distribution of main belt asteroids (red line, representing the current asteroid belt multiplied by a depletion factor of 540) from 60 to 200 km in radius. The size distribution becomes shallower above 200 km; this is also seen in the asteroid belt, although the simulations underproduce Ceres-sized planetesimals by a factor of about 2 to 3. A simulation with no chondrules (blue line) produces no asteroids larger than 300 km. Inclusion of chondrules up to centimeter sizes (pink line in insert) gives a much too low production of Ceres-sized asteroids, whereas setting the exponential cutoff radius of planetesimals to 50 km (green line) leads to a poorer match to the bump at 60 km. The right plot shows that the formation of the first embryos after 2.5 My quenches chondrule accretion on the smaller asteroids by exciting their inclinations i (right axis). The dotted lines indicate the mass contribution from planetesimal-planetesimal collisions. Asteroids and embryos larger than 200 km in radius owe at least two-thirds of their mass to chondrule accretion.
