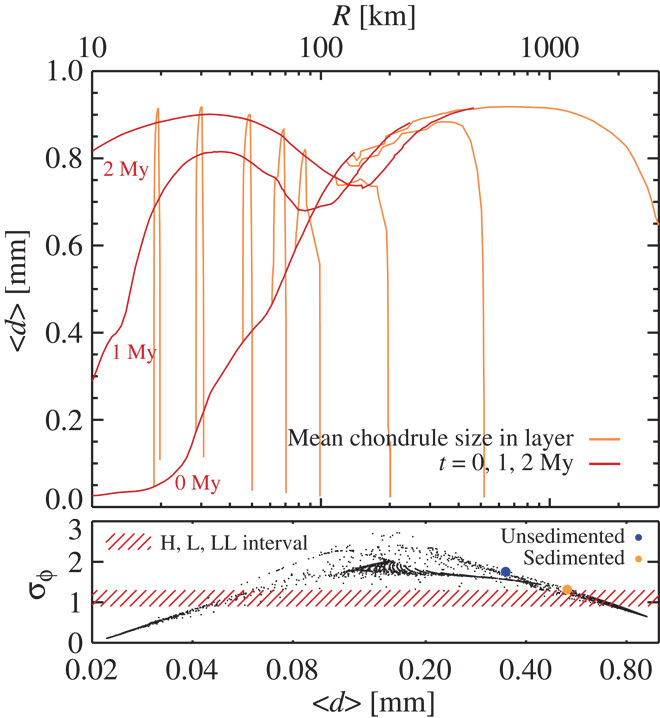
Fig. 6. Mean chondrule sizes (〈d〉, upper panel) as a function of layer radius R and size distribution width (σφ, lower panel) as a function of mean chondrule size.

Yellow lines in the upper panel indicate the chondrule size evolution in individual asteroids and embryos, whereas red lines indicate mean accreted chondrule sizes at different times. The accreted chondrule size increases approximately linearly with planetesimal size at t = 0 My. Asteroids stirred by the growing embryos over the next 2 My accrete increasingly larger chondrules because asteroid velocities align with the sub-Keplerian chondrule flow at aphelion. Finally, asteroids accrete surface layers of mainly very small chondrules, down to below 0.1 mm in diameter, at late times when their large inclinations decouple the asteroid orbits from the large chondrules in the mid-plane. The width of the chondrule size distribution in the lower panel is given in terms of σφ, the base-2-logarithmic half-width of the cumulative mass distribution of chondrules (σφ = 1 implies that two-thirds of the chondrules have diameters within a factor 21 = 2 from the mean). Dots indicate chondrule layers inside asteroids and embryos. Chondrules are aerodynamically sorted by the accretion process to values of σφ in agreement with the chondrules found in ordinary chondrites (hashed region). Unfiltered accretion from the background size distribution of chondrules (blue dot, size distribution of unsedimented particles; yellow dot, size distribution in the mid-plane) yields specific pairs of 〈d〉 and σφ that are not consistent with constraints from ordinary chondrites.
