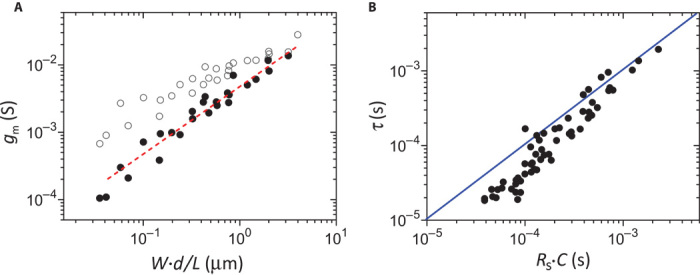
Fig. 2. Scaling of OECT metrics with channel geometry.

(A) Scaling of OECT transconductance. Open symbols correspond to peak transconductance [at VD (drain voltage) = −0.5 V and VG that corresponds to maximum transconductance], and solid symbols are the transconductance at saturation (at VG = 0.4 V and VD that corresponds to saturation). The line is a linear fit (r2 = 0.96) to the transconductance at saturation (Eq. 1). (B) Correlation between OECT response time, obtained from drain current transients, and Rs·C time, obtained by impedance spectroscopy. The line is a guide to the eye with a slope of 1 and represents the expected behavior τ = Rs·C.
