
Fig. 7. T1 measurements.
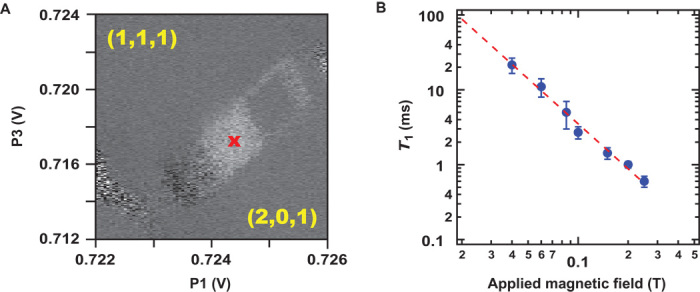
(A) Plot of current versus the DC bias on P3 and P1 while running a pulse sequence creating triplets utilizing the paramagnetic field. The white square depicts the bias space where Pauli blockade occurs, and the red “x” denotes the location where T1 measurements were made. (B) A plot of T1 of triplets in the readout window versus external magnetic field. The blue points show the fit values and uncertainty of exponential triplet decay rate as a function of wait time, and the dashed red line is a fit to T1 ∝ 1/B2.