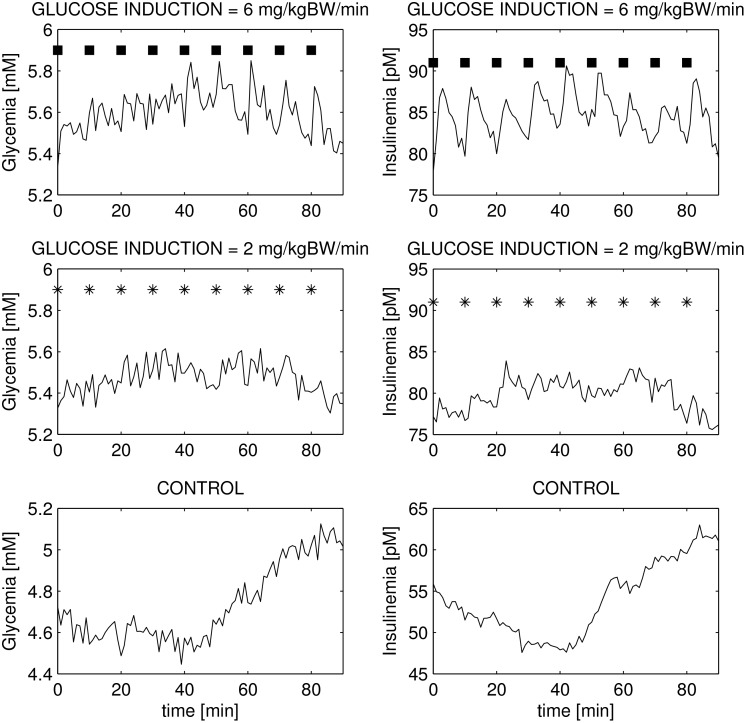
Fig 10. Glucose/insulin concentrations during high frequency minimal stimulation.
Glucose (left panels) and insulin (right panels) evolution during a 1h30’ period with 6 (upper panels), 2 (center panels) and 0 (lower panels) mg/kg/min intravenous glucose administration. Compare this figure with Fig 1 by Pørksen et al. [15].

