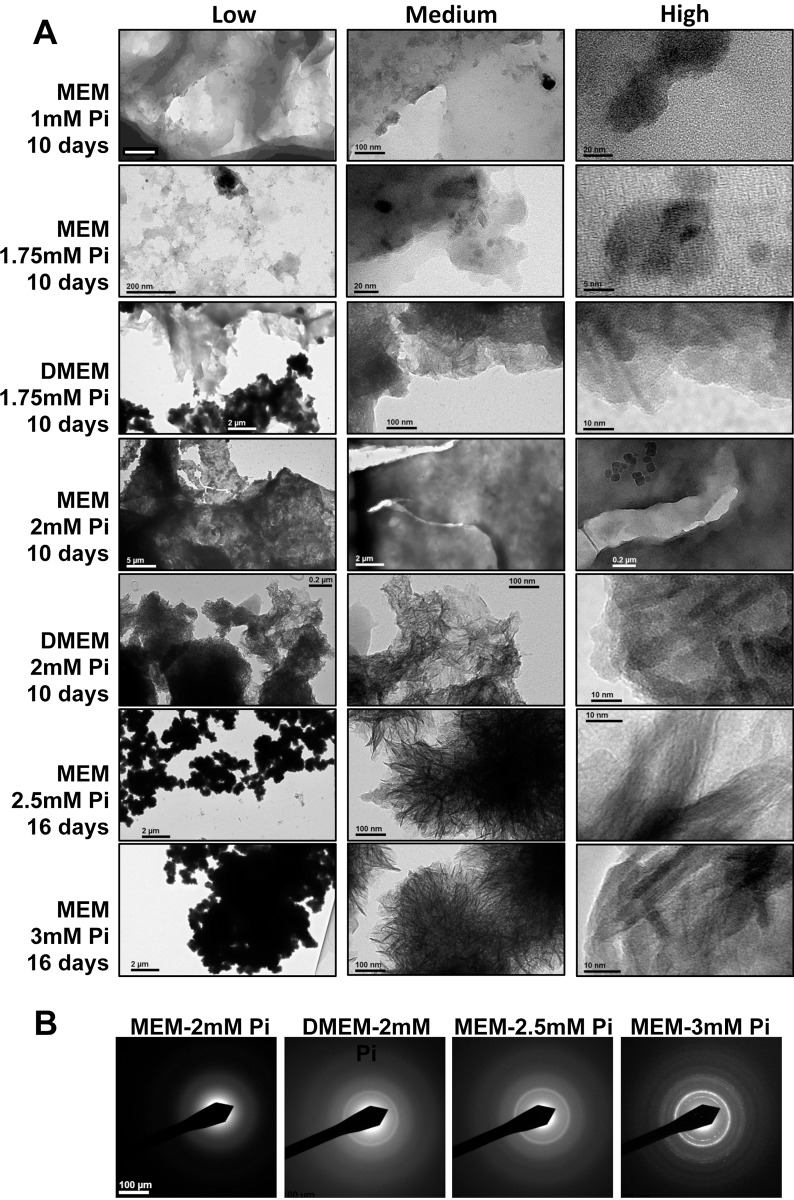
Fig 6. Ultrastructural analysis of deposits.
(A) TEM images of deposits at different magnifications, from cells incubated as indicated at the left of each row. Images in the first column, at low magnification, are indicative of the density of the deposits, which is clearly increasing with the Pi concentration; images in the second column, with medium magnification, show the microstructures of the deposits, which gradually adopt a spherulite arrangement of needle-like particles as the concentration increases; images in the third column, at high magnification, show the shape and size of crystalline nanoparticles. (B) Electron diffraction patterns of cell culture deposits from A, showing an increasing crystallinity from MEM to DMEM, and from 2mM Pi to 3mM Pi. Using MEM at 2mM Pi for 10 days, ED revealed no reflections from crystal planes, however, when DMEM was used instead, crystallization rings at 2.81 and 3.52Å were observed, compatible with those of hydroxyapatite (2.82 and 3.44Å). MEM at 2.5 and 3mM Pi for 16 days also revealed a hydroxyapatite crystallization pattern, with clear reflections at 3mM.

