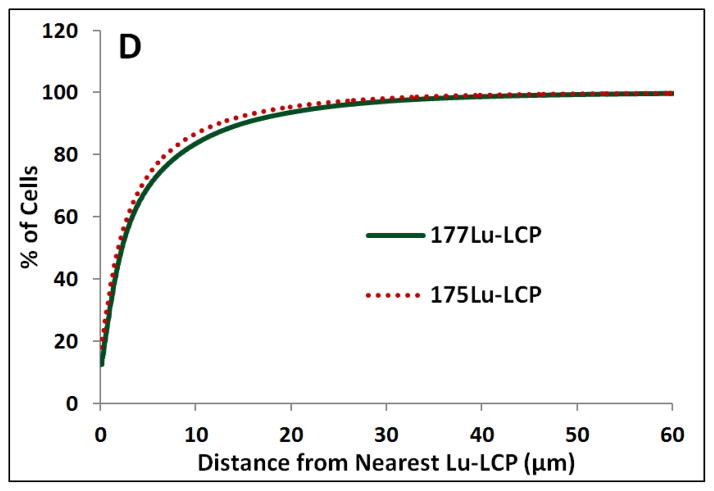
Figure 11.
Quantification of DiI distribution at t = 2 days: A) UMUC3/3T3-GFP tumor given DiI-177Lu-LCP; scale bar = 500 μm; B) Isolated DiI signal from panel A; C) Heat map showing each cell’s distance from its nearest Lu-LCP, where black and blue areas show areas of close proximity between cells and particles; D) Quantification of relative cell distance from Lu-LCP; n = 1.75×10⁶ cells in 8 sections; n = 4 sections each for 177Lu-LCP and 175Lu-LCP.


