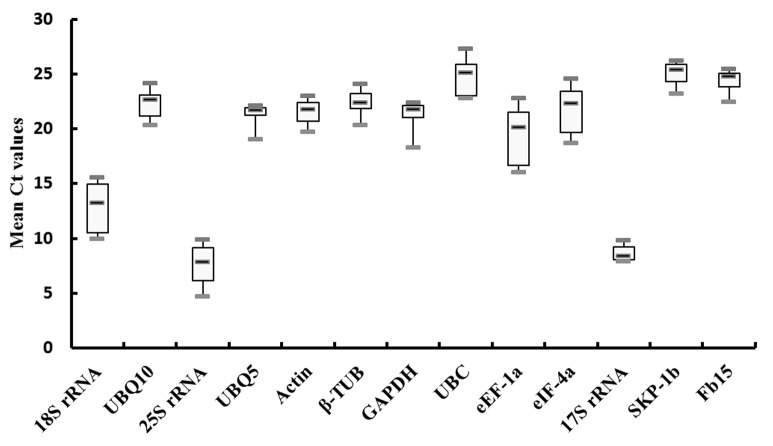
Fig 2. CT values of the candidate reference genes in qRT-PCR assay.
Expression data displayed as CT values for each candidate reference gene in all samples. A line across the box is depicted as the median. The boxes indicate the 25th and 75th percentiles. Whiskers represent the maximum and minimum values.

