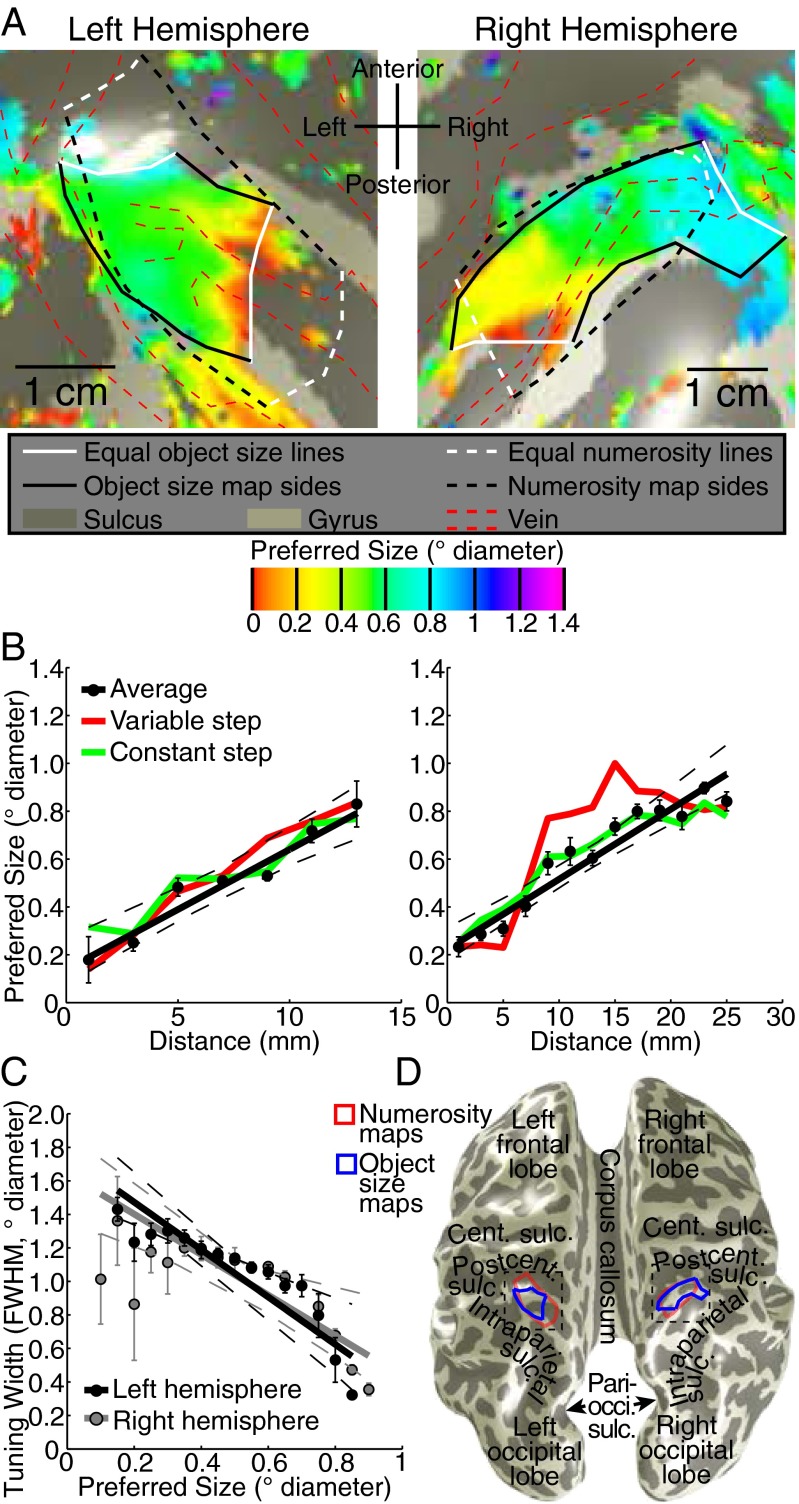
Fig. 2.
Topographic representation of object size. (A) Object size preferences surrounding the previously described numerosity map (white and black dashed lines) (9) for data averaged from both stimulus conditions. Preferred object size changes gradually between lines of equal minimal and maximal preferred object size (white lines) in both hemispheres, forming topographic maps (black and white solid lines). Areas of low signal intensity, corresponding to pial veins (red dashed lines) (Fig. S3), were excluded from further analysis (21). (B) Object size preferences progress approximately linearly along the map. Recording sites were organized by their distances from the white lines in A. The two stimulus conditions are shown as colored lines joining condition-specific bin means. (C) Tuning width decreases as preferred object size increases. (D) Locations of object size and numerosity maps on an inflated cortical surface, relative to nearby major anatomical landmarks. Dashed boxes show the areas detailed in A. Cent., central; Pari-occi., parieto-occipital; Postcent, postcentral; Sulc., sulcus. In B and C, all dots represent the mean in each bin. Error bars represent SEs. All dashed lines represent 95% confidence intervals of the fit (solid line) to the bin means.

