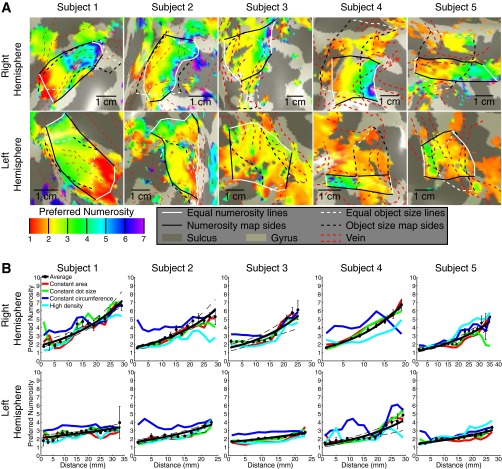
Fig. S7.
Maps of preferred numerosity. (A) Preferred numerosity varies across the cortical surface, in data averaged over all numerosity stimulus conditions. Topographic organization is clearer in the right hemisphere than in the left. Colors represent different preferred numerosities rendered on an inflated back view of the cortical surface, in the same area of cortex shown in Fig. S4. An area of clear topographic representation is defined in black and white. The borders of this area representing minimum and maximum equal preferred numerosities are shown as white lines at the medial and lateral ends of the map. The posterior and anterior borders of this topographic representation are shown as black lines. Data are thresholded based on goodness of fit: In the average data, only recording points where R2 is above 0.3 (P < 0.007) are shown; for all individual conditions the R2 threshold is 0.25 (P < 0.015). Recording points where the model fits a preferred numerosity outside of the stimulus range are not shown. Dashed red lines outline distortions in the data caused by the presence of large veins on the pial surface (Fig. S3). The object size maps described in Fig. S4 are shown as black and white dashed lines. (B) Progression of preferred numerosity with distance along the maps shown in A in the average data for each subject. Different stimulus conditions are represented as colored lines joining the condition-specific bin means. In the left hemisphere, the rate of change of preferred numerosity across the cortical surface is less than in the right hemisphere, as is the interquartile range of preferred numerosities present in the map. Map organization in the right hemisphere is also more consistent between conditions. Points represent the mean preferred numerosity in each distance bin, with error bars representing the SE. Solid lines are the fit to the bin means. These fit lines are straight in logarithmic space. Dashed lines represent 95% confidence intervals determined by bootstrapping fits to the binned points. For the average of all stimulus conditions, numerosity preferences increase significantly across the map, at P < 0.0001 in each hemisphere (permutation analysis).

