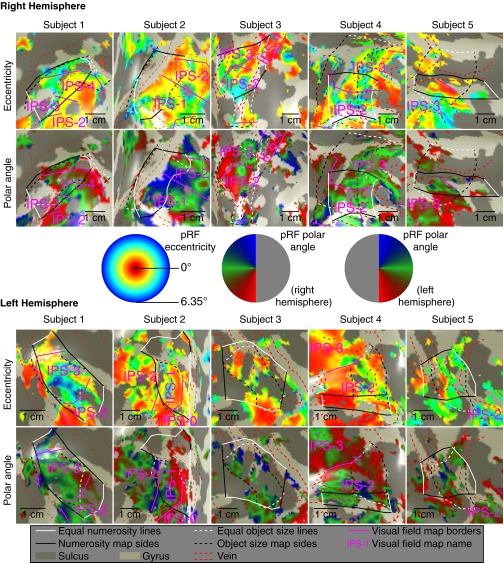
Fig. S9.
Visual field map representations around the object size and numerosity maps, showing the same views seen in Figs. S4, S7, and S8. Borders between visual field maps are marked by purple lines. Dashed red lines show locations of veins, solid black and white lines show the borders of numerosity maps, and dashed black and white lines show the borders of object size maps, as in previous figures. Although visual field maps overlap with the object size numerosity maps, their borders do not correspond and there is no clear relationship between them. (Middle) Relationship between displayed color and preferred visual field position in visual field eccentricity and polar angle.

