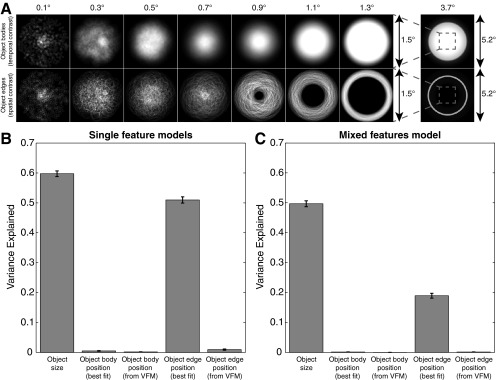
Fig. S11.
Distribution of visual field stimulation for different object sizes, and the potential predictive accuracy of retinotopic stimulation in explaining recorded responses. (A) Stimuli are designed to place object bodies randomly in the same stimulus area for all object sizes, minimizing links between particular visual field positions and particular object sizes. Furthermore, the largest object shown (3.7°) completely covers the area where other object sizes could be presented. This stimulates all these visual field positions but reduces response amplitudes. However, the positions of object edges are unavoidably linked to object size: Larger object sizes tend to have edges at higher eccentricities. Furthermore, the largest object has no edges in the central visual field, consistent with a decrease in response amplitude. Light intensities show positions where object bodies or edges are most likely to appear for a particular object size. (B) Response variance explained by separate models tuned to object size or visual field positions responding to object bodies or edges. Object size tuning predicts responses most closely, but tuned responses to object edge position can predict response well if allowed to choose any position tuning parameters. Here, pRF preferred positions are consistently at the visual field center, with position tuning widths (i.e., pRF sizes) increasing with preferred object size. Responses to conventional visual field mapping (VFM) stimuli, on the other hand, demonstrate that these recording sites prefer visual field positions outside the visual field center. If visual field position tuning properties are taken from VFM models, they predict responses poorly. (C) Response variance explained by the same response predictions when used as components of a single general linear model. Object size tuning continues to predict responses well, but any visual field position tuning captures little additional response variance. Error bars show 95% confidence intervals.

