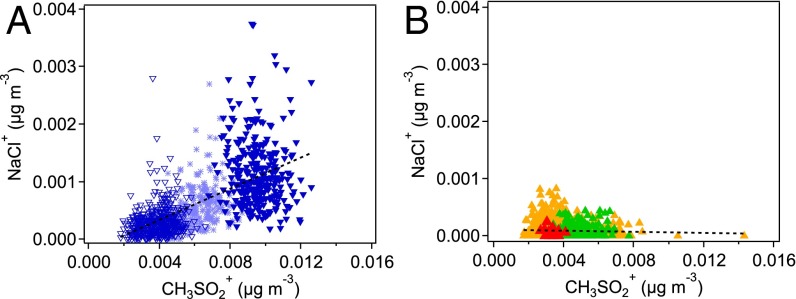
Fig. 5.
Plots of Na35Cl+ ion versus MSA ion (CH3SO2+). (A) NaCl and MSA are correlated (overall r2 = 0.41) for (light blue ⋆) August 2, 2012 (9:15–14:20), (dark blue ▿) August 27, 2012 (10:00–20:05), and (dark blue ▾) August 31, 2012 (10:20–16:50). (B) NaCl and MSA are uncorrelated (overall r2 = 0.0023) for (orange ▴) July 28, 2010 (10:10)–July 29, 2010 (15:00), (green ▴) May 14, 2012 (10:35–13:55), and (red ▴) August 26, 2014 (13:50–14:05). Measurements were made in Irvine, California. Mass loading for NaCl is uncorrected for its low sensitivity in the AMS due to inefficient vaporization. Data points represent 1–2-min sampling times. Dashed lines are linear fits to all data points in each plot.

