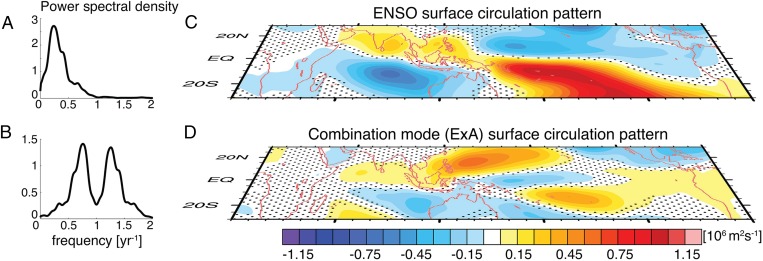
Fig. 1.
Schematic for the ENSO (E) and combination mode (ExA) anomalous surface circulation pattern and corresponding spectral characteristics. (A) Power spectral density for the normalized N3.4 index of the Hadley Centre Sea Ice and Sea Surface Temperature data set version 1 (HadISST1) 1958–2013 SSTA using the Welch method. (B) As in A but for the theoretical quadratic combination mode (ExA). (C) Regression coefficient of the normalized N3.4 index and the anomalous JRA-55 surface stream function for the same period (ENSO response pattern). (D) Regression coefficient of the normalized combination mode (ExA) index and the anomalous JRA-55 surface stream function (combination mode response pattern). Areas where the anomalous circulation regression coefficient is significant above the 95% confidence level are nonstippled.

