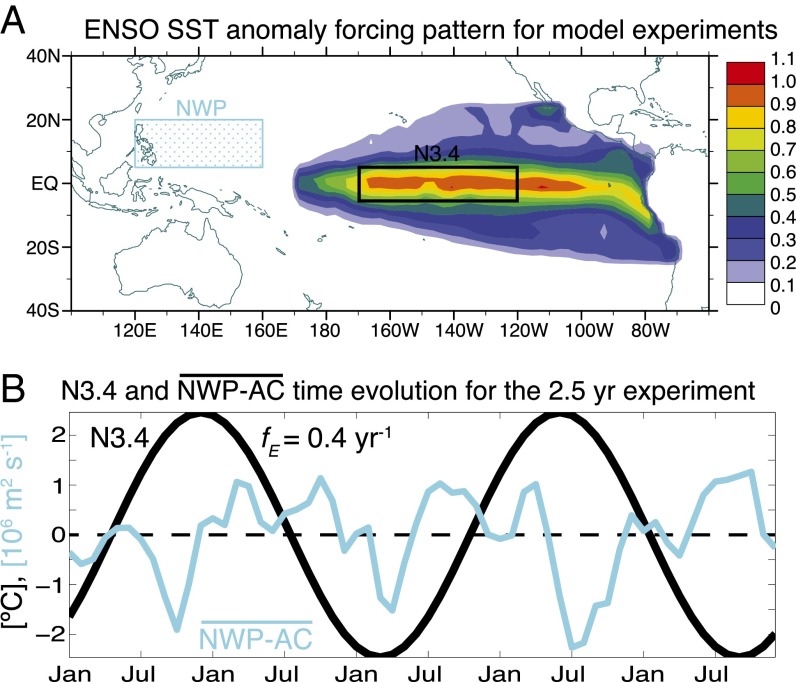
Fig. 2.
(A) ENSO SST anomaly forcing pattern for the AGCM experiments. The amplitude of the anomaly pattern is given by the colored shading (no units). The N3.4 (black) and NWP (cyan) regions are marked by two boxes. (B) The time evolution of the N3.4 SST anomaly index (black) and the anomalous ensemble mean circulation index (cyan) for the 2.5-y experiment.

