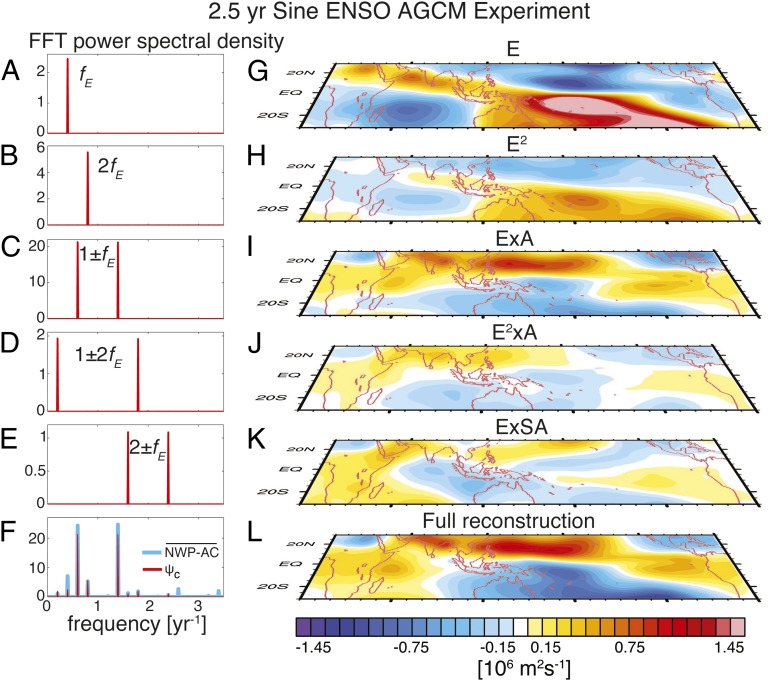
Fig. 3.
(A−E) Power spectral density for the individual reconstruction components for the 2.5-y Sine ENSO AGCM experiment using the averaged coefficients using the fast Fourier transform (FFT) method. (F) Power spectral density for the anomalous ensemble mean circulation index for this experiment (light blue lines) and the full reconstruction (red lines) using all of the terms depicted in A−E. (G−K) Regression coefficient of the normalized respective reconstruction component and the anomalous surface stream function of this experiment: (G) E, (H) E2, (I) ExA, (J) E2xA, and (K) ExSA. (L) Regression coefficient of the normalized full reconstruction time series and the anomalous surface stream function of this experiment.

