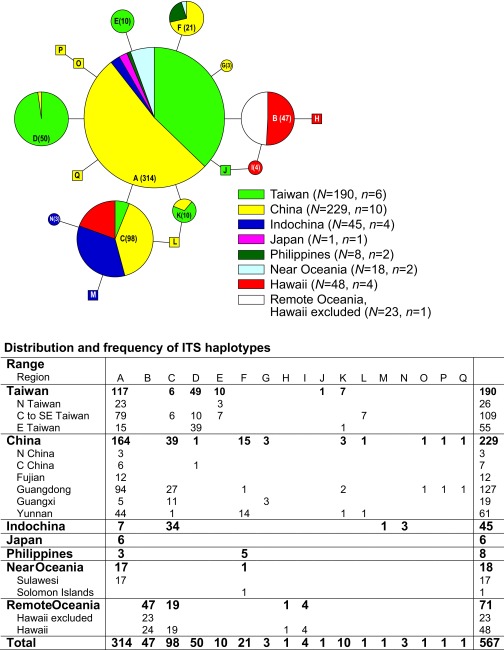
Fig. S1.
ITS haplotype network (n = 17, A–Q) and haplotype distribution and frequency. The haplotype network was reconstructed using TCS (34), with alignment gaps treated as missing data. The sizes of the circles and pie charts are proportional to the frequency of the haplotype (shown in parentheses). Squares denote unique haplotypes (haplotype found only in one individual).

