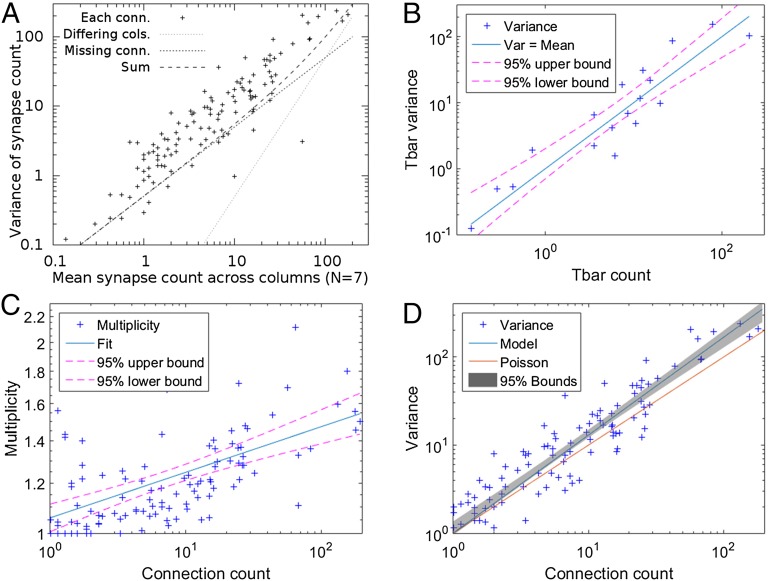
Fig. 2.
Variation as a function of mean synapse count among connections of the core connectome. (A) Crosses represent the variation in each connection for the seven columns of the core connectome as a function of the mean connection count. Lines represent the two main experimental contributions to this variance, and their sum. “Differing cols.” shows the contribution that would be measured if each column were identical but reported to the estimated completeness. “Missing conn.” shows the variation expected from the incomplete reporting of synaptic contacts, assuming a binomial distribution with P = 0.5. The sum of these experimental artifacts falls well short of the observed variation. (B) Variation in T-bar counts across columns, from medulla stratum M2. A model with variance equal to the mean explains the data to within experimental error. (C) Multiplicity as a function of synapse count. (D) Same data as in A, plus a gray band showing the 95% confidence limits from fitting a straight line to these data. The best fit, not shown, is centered in the gray band. The proposed model from the text, combining the T-bar variance, the multiplicity, and the estimated experimental error, accounts reasonably well for the overall variance. A purely Poisson model, also shown, underpredicts this variance.

