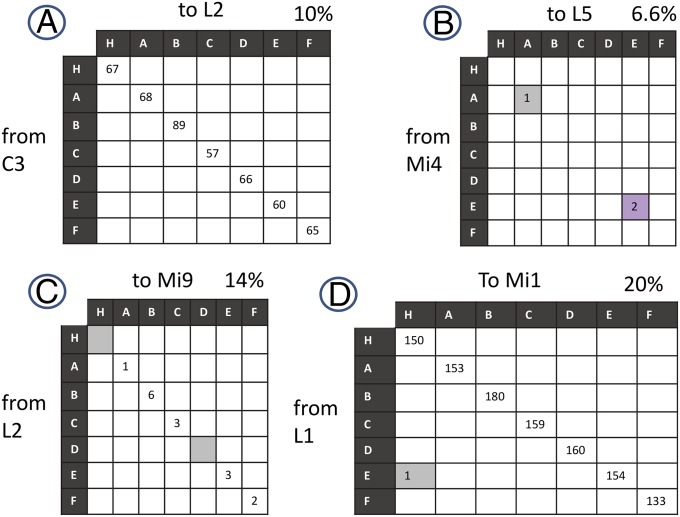
Fig. 4.
Characterizing connection errors. Plots for each synapse class between presynaptic (vertical columns) and postsynaptic (horizontal rows) partners. Each entry intercept is the number of synaptic contacts from the presynaptic cell (Left) to its postsynaptic partner (Top) for each of the seven columns [Home (H) and A–F]. (A) Completely consistent connection, with seven-column variation in connection strength. (B) Class E + U errors. (C) Class E− errors. (D) Class E + N errors. ICs are shaded throughout. The percentage (of all 400 pre/post pairs) with this pattern is shown at the top right of each matrix. Not shown are examples lacking connections (60%) and connections that did not fall into the patterns shown here (3.5%). The sum exceeds 100% because a single cell pair can have both missing and extra connections.

