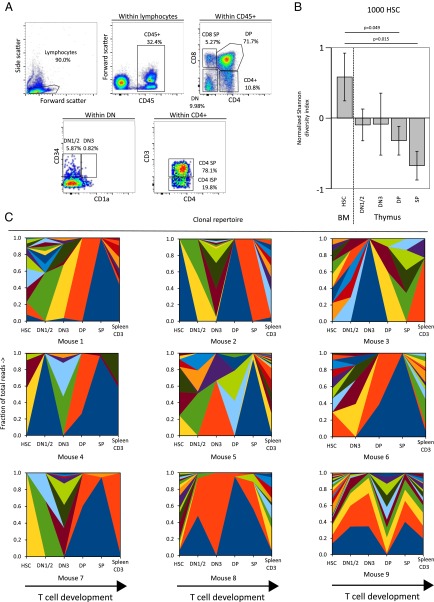
Fig. 3.
Clonal restriction during T-cell development. Thymus was homogenized and cells were sorted into their developmental stages (DN1/2, DN3, DP, SP) (A). The number of clones contributing >1% of the sample in nine mice transplanted with barcoded HSCs or CD34+ cells were counted and the Shannon diversity index calculated. The normalized Shannon diversity was compared between HSC in the BM and the developmental stages in the thymus. Mean normalized Shannon diversity indices for nine mice transplanted with 1,000 HSC are shown with error bars indicating SEM (B). Wilcoxon P values are shown in B. (C) Clonal repertoire, as determined by barcode analysis of sorted population in the thymus in stacked area graphs (as in A), with colors identifying the individual clones. Note that the colors are chosen for the purpose of display, which means that the same color depicts different clones in different mice.

