Fig. S1.
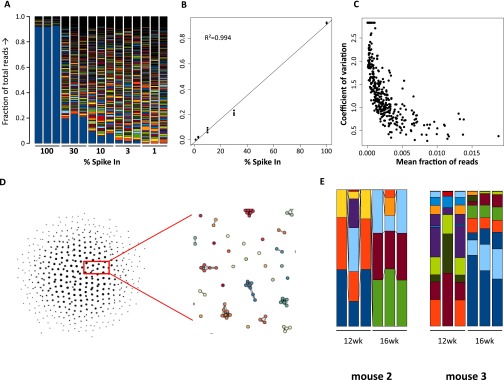
Spike-in experiments to calibrate the DNA barcoding method. A plasmid sample was spiked in at equimolar ratio and diluted into a bulk barcoded sample. The bargraph shows the measured fraction of deep-sequencing reads in each sample, with the lowest blue bar in the graph indicating the spiked-in plasmid (A). Triplicate analysis of the fraction of reads made up by the spiked-in barcode shows the least-squares fitted line and the Pearson correlation coefficient. (B). In an additional experiment, nine repeated measures of the same sample were performed and the coefficient of variation was determined and plotted against the mean fraction of reads, showing that the precision of quantification increases with the amount of reads (C). A higher number of barcodes than the library complexity was retrieved from the analysis of these samples. To correct for these sequencing errors, the number of dissimilar bases between all barcodes was determine and a directed acyclic graph was built for all barcodes that had less than three bases difference. Using this graph and an empirically determined threshold of two bases differences between barcodes, the reads of barcodes with <three bases difference were combined. All barcoding data in the report was processed using this procedure (D). Samples of PB CD19+ B cells were analyzed in triplicate to determine the variation of the method between samples (E). Fraction of total reads is indicated on the y axis.

