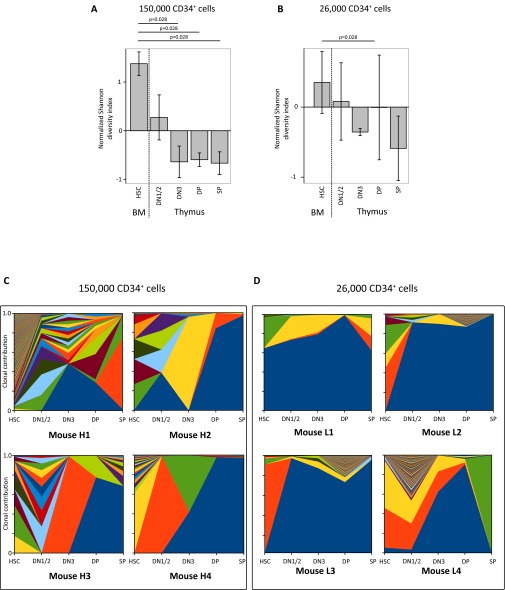
Fig. S3.
Clonal restriction during T-cell development after CD34+ cell transplantation. Similar to the data in Fig. 2, the normalized Shannon diversity was compared between the developmental stages in the thymus of four mice transplanted with 150,000 CD34+ cells (A) or four mice transplanted with 26,000 CD34+ cells (B). Kruskal–Wallis P values are shown in A and B. (C and D) The clonal contribution in the thymic subsets of mice transplanted with 150,000 or 26,000 barcoded human CD34+ cells is shown in stacked area graphs using colors to mark the individual barcoded clones in mice receiving a high (150,000 cells, C) or low (26,000 cells, D) dose of barcoded CD34+ cells.

