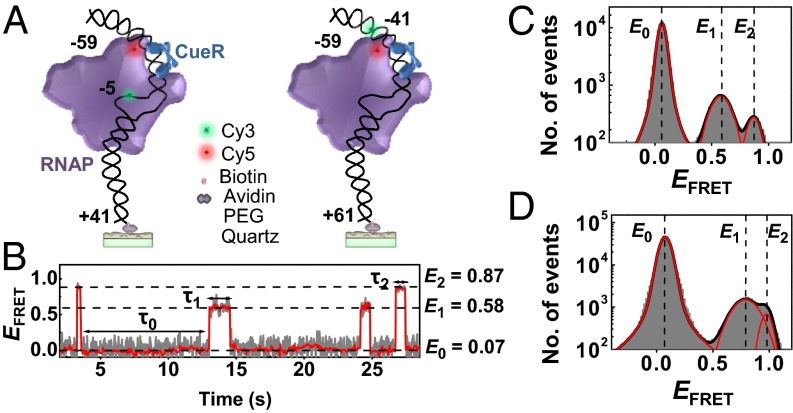
Fig. 2.
SmFRET of RNAPCy5−PcopACy3 interactions. (A) Scheme for surface immobilization and labeling of PcopACy3@−5 (Left) or PcopACy3@−41 (Right) for interacting with σ70-containing RNAPCy5 holoenzyme (and CueR) in solution. Scheme generated based on a structure model (SI Appendix, Fig. S1 C and D). (B) Single-molecule EFRET trajectory of an immobilized PcopACy3@−5 interacting with RNAPCy5 (2 nM). The dwell times on the E0, E1, and E2 states are τ0, τ1, and τ2, respectively. Gray line, original data; red line, after nonlinear filtering. (C) Histogram of EFRET trajectories of RNAPCy5−PcopACy3@−5 interactions at 2 nM RNAPCy5. Red lines are resolved peaks centered at EFRET ∼0.07, ∼0.58, and ∼0.87, with percentage areas of 92.1 ± 2.4, 6.2 ± 0.6, and 1.7 ± 0.5%, respectively. (D) Same as C, but with PcopACy3@−41. Three peaks centered at EFRET ∼0.07, ∼0.78, and ∼0.95, with percentage areas of 92.4 ± 1.9, 5.9 ± 1.4, and 1.7 ± 0.2%, respectively.

