Fig. 5.
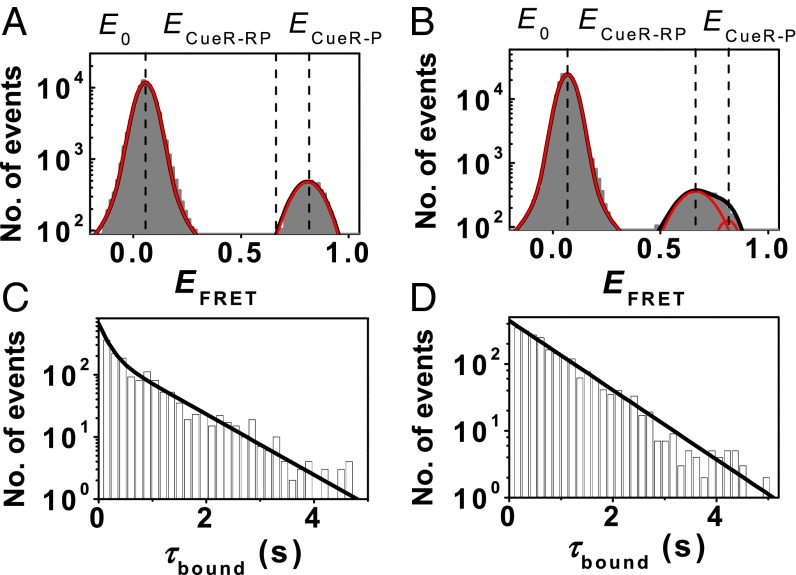
CueRCy5−PcopACy3@−41 interactions in the absence and presence of RNAP. (A) EFRET histogram of holo-CueRCy5−PcopACy3@−41 interactions at 2 nM [holo-CueRCy5]. Two resolved peaks centered at E0 ∼0.07 and ECueR-P ∼0.81. (B) Same as A, but in the presence of 100 nM unlabeled RNAP. Three resolved peaks centered at E0 ∼0.07, ECueR-RP ∼0.68, and ECueR-P ∼0.81. (C) Distribution of τbound for holo-CueRCy5−PcopACy3@−41 interactions at 2 nM holo-CueRCy5. Solid line is a fit with a sum of two exponentials. (D) Distribution of τbound for holo-CueRCy5−PcopACy3@−41 at 2 nM holo-CueRCy5 and in the presence of 100 nM unlabeled RNAP. Solid line is a single exponential fit.

