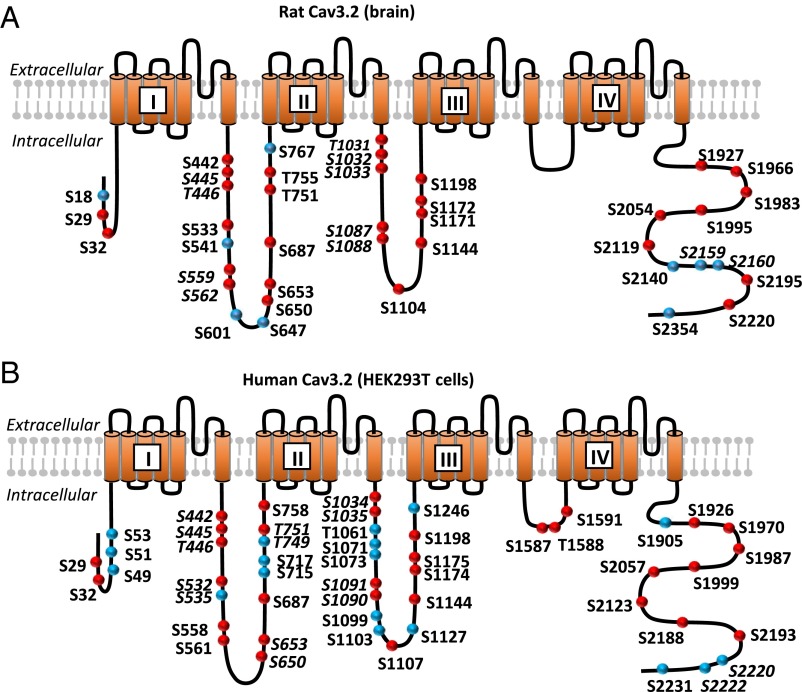
Fig. 1.
Schematic representation of the Cav3.2 MS analysis. (A) Cartoon of the membrane topology of Cav3.2 showing the phosphorylation sites identified in rat brain. (B) Cartoon of the membrane topology of human Cav3.2 showing the phosphorylation sites identified in in HEK293T cells. The red circles indicate the sites identified as phosphorylated in both rat brain and HEK293T cells. Correspondence between the amino acid numbering of the rat and human Cav3.2 isoform is given in Table S1. The unambiguous sites are bold, and the ambiguous sites are bold and italicized. Liquid chromatography–MS/MS sequence coverage of the Cav3.2 protein and the MS/MS spectra of the Cav3.2 peptides can be found in Figs. S1 and S2 and Dataset S1.

