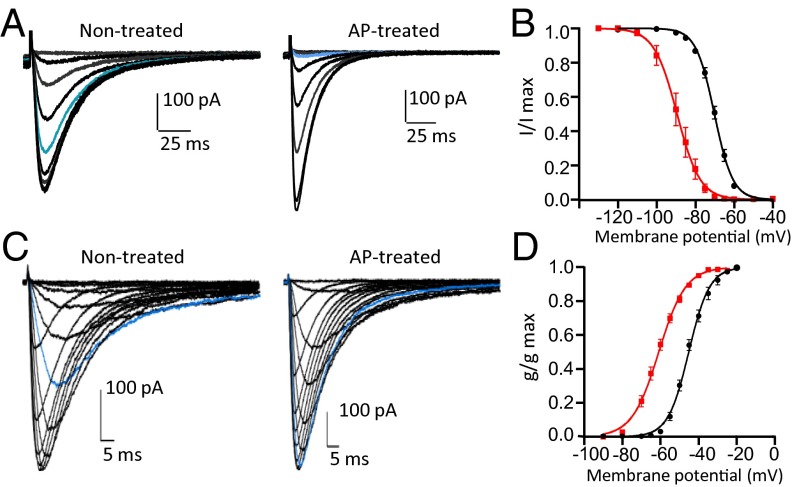
Fig. 2.
AP effect on biophysical properties of Cav3.2 channels. (A) Representative currents elicited by test pulses from different holding potentials (−110, −100, −90, −85, −80, −75, −70, −65, −60, and −50 mV) for 5 s to −30 mV for the cells nontreated or treated with AP. HEK293T cells expressing human Cav3.2 were treated by adding AP into the patch pipette (100 U/mL) and letting it dialyze into the cell for 30 min. For the control cells, the current was recorded after 30 min of dialysis of the internal solution without AP. Note the change in the current amplitude for the trace in blue (holding potential was −75 mV) in the presence of AP as well as the changes in the kinetics. (B) Steady-state inactivation curve fit from traces in A for the control cells (black circles; n = 5) and the AP-treated cells (red squares; n = 11). (C) Representative currents elicited from a holding potential of −100 mV to different test pulse potentials (−90, −80, −70, −65, −60, −55, −50, −45, −40, −35, −30, −25, −20, and −10 mV) for the cells nontreated or treated with AP. Note the change in the amplitude of the current for the trace in blue (test pulse potential was −50 mV) in the presence of AP as well as the changes in the kinetics. (D) Steady-state activation curve fit from traces in C for the control cells (black circles; n = 4) and the AP-treated cells (red squares; n = 12).

