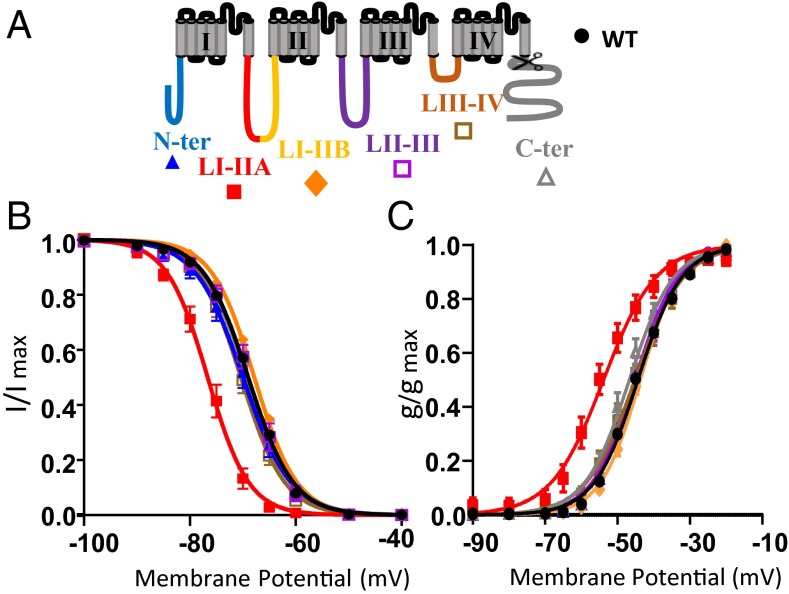
Fig. 3.
Electrophysiological analysis of the phosphorylation mutants. (A) Cartoon of the membrane topology of Cav3.2 showing the region mutated for the different constructions (Table 1 shows details regarding the mutated residues for each construction). (B and C) Steady-state inactivation curves and steady-state activation curves, respectively, for the WT (black circles), N-ter Ala (blue triangles), LI-II A Ala (red squares), LI-II B Ala (orange diamonds), LII-III Ala (purple squares), LIII-IV Ala (brown squares), and C-terΔ (gray triangles).

