Fig. 4.
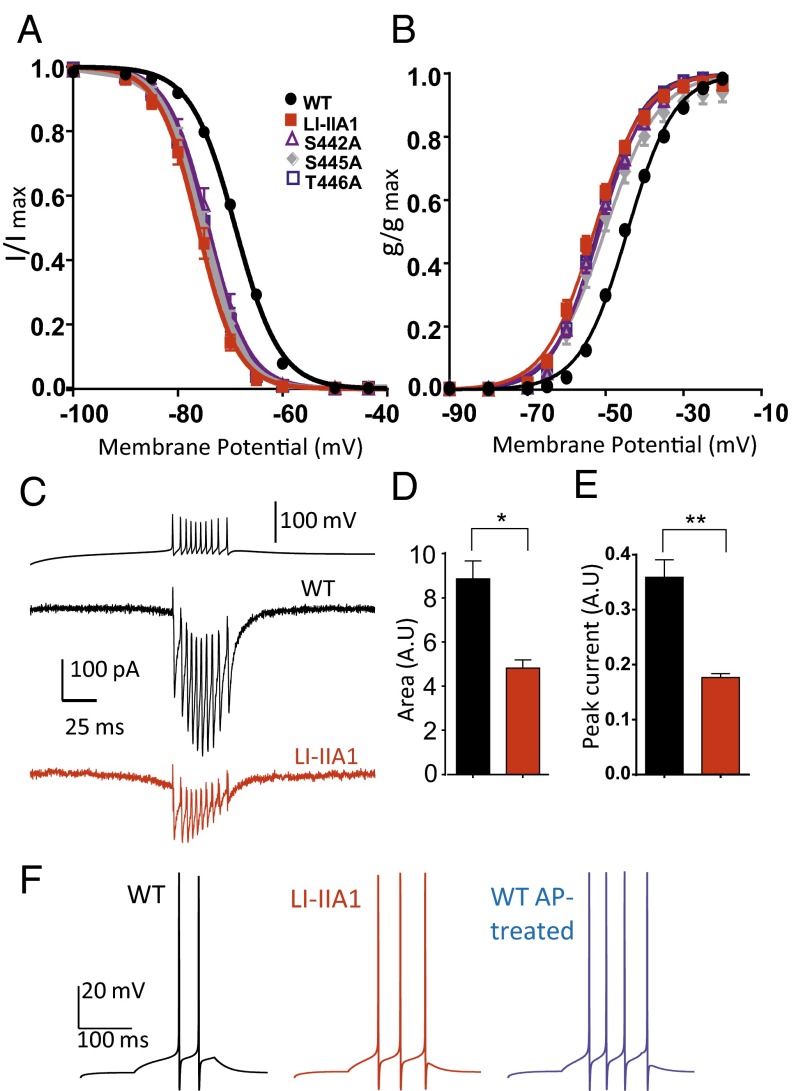
Effect of mutation of the phosphorylation loci S442, S445, and T446. (A and B) Steady-state inactivation curves and steady-state activation curves, respectively, for the WT (black circles; n = 62–68), LI-IIA1 (red squares; n = 11), S442A (purple triangles; n = 8), S445A (gray diamonds; n = 7), and T446A (blue squares; n = 8). (C) Representative calcium current trace for the WT (black trace) and the LI-IIA1 mutant (red trace) recorded during a voltage-clamp firing pattern of a thalamic reticular neuron generated by the NEURON model. Please note that these representative recordings were obtained in cells exhibiting similar current density when recorded at −30 mV from a holding potential (HP) of −110 mV. (D) Calcium current area quantification from traces in C. (E) Peak calcium current quantification from traces in C. The WT is represented in black (n = 3), and the LI-IIA1 mutant is represented in red (n = 3). (F) Reticular thalamic neuron firing simulation using values obtained with WT (black trace), LI-IIA1 mutant (red trace), and AP-treated WT (blue trace) channels. The current clamp responses were elicited by a 0.037-nA current injection for 150 ms in a dendrite of the detailed cell model from a holding potential of −70 mV.

