Fig. 2.
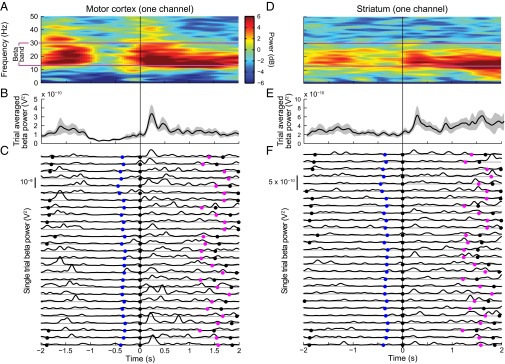
Examples of LFP activity recorded on individual channels from motor cortex (A–C) and striatum (D–F) in one session from 2 s before until 2 s after the end of the third (final) movement. (A and D) Spectrograms averaged over 27 correct 3M3T trials with the long-long-long hold sequence and the up/left-down-left spatial sequence, with power coded as in Fig. 1. Purple lines denote the beta band. The color scale in A applies to D as well. (B and E) Time course of average power in the 13–30 Hz pass band (black lines) with 95% confidence limits (gray shading). (C and F) Smoothed power traces for each of the 27 trials. The gray horizontal lines below each trace represent zero power. Blue, purple, and black dots mark the onset of third movement, reward delivery, and end of movements/reward delivery, respectively.

