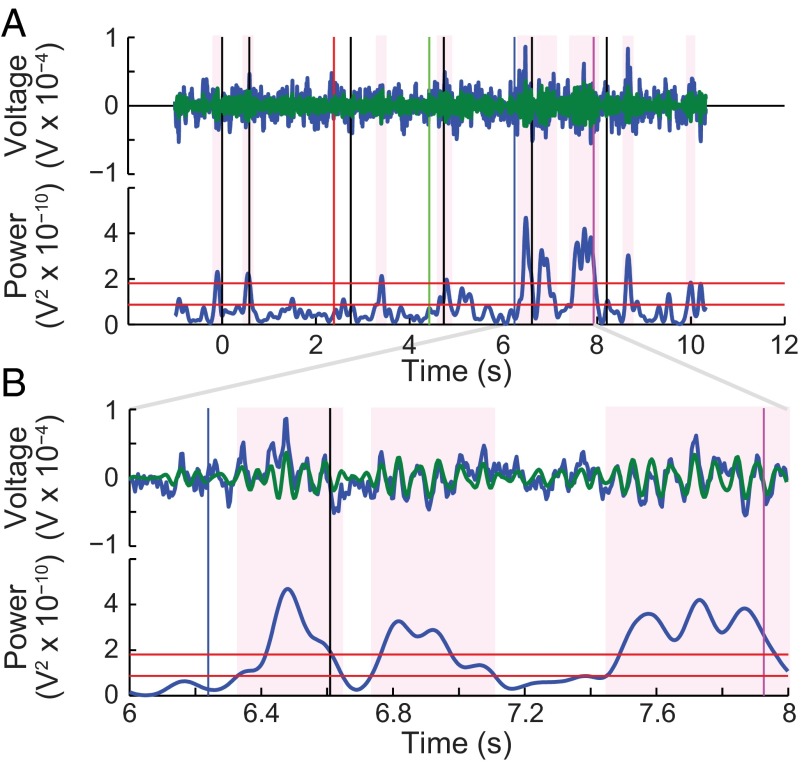
Fig. 4.
Procedure for measuring beta bursts illustrated for LFP recorded in the motor cortex in a single trial. Events are shown as in Fig. 1. (A, Upper) Raw LFP (blue) and beta bandpass-filtered LFP (green) superimposed. (Lower) Beta-band power together with red horizontal lines at the two thresholds used (1.5 times and 3 times the median power, respectively). Shading indicates individual burst periods. (B) Same data as in A on an expanded time scale.

