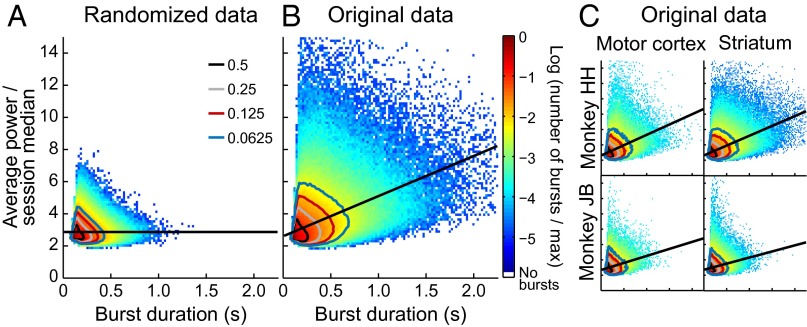
Fig. 5.
Joint distribution of duration and power values across all marked beta bursts in the dataset. Contour lines show the boundaries of the tails containing one-half (black), one-quarter (gray), one-eighth (red), and one-sixteenth (blue) of the counts. Straight black lines show least squares fits. (A) Phase-randomized control channels. (B) Actual (nonrandomized) LFPs. (C) Same data as in B, but plotted separately for monkey and brain region.

