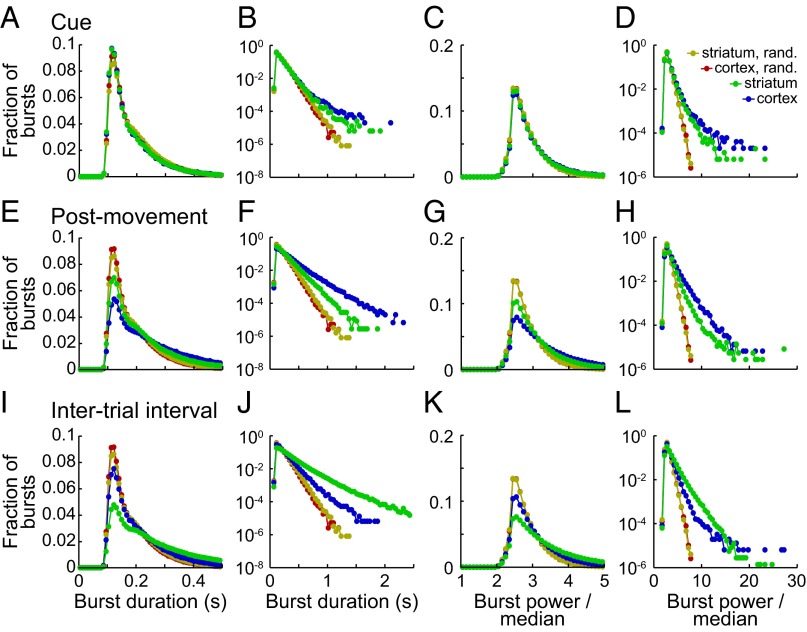
Fig. 6.
Histograms showing the distributions of duration and power of bursts with peaks detected during the cue period (A–D), postmovement period (E–H), and ITI (I–L). Data were aggregated across both tasks and both monkeys for the motor cortex (blue) and striatum (green). Plots are paired, with the peaks of the distributions on a fine scale on the left and the logarithms of the distributions on a coarse scale on the right. The first two columns show durations, and the last two show power averaged over the whole burst. Results aggregated across all task periods are also shown for the phase-randomized counterparts of the signals from motor cortex (red) and striatum (gold).

