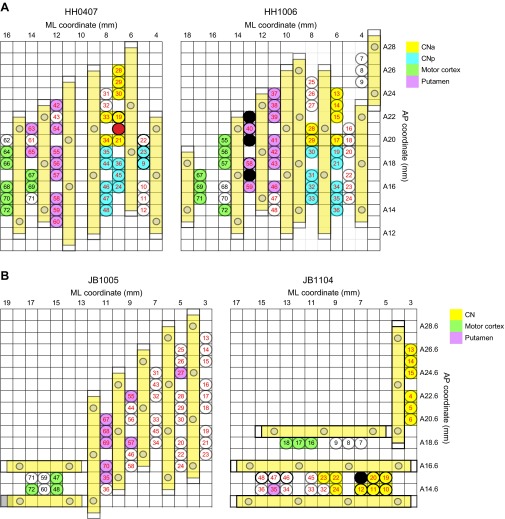
Fig. S1.
Grid maps illustrating electrode placements in the mediolateral (ML) versus anteroposterior (AP) plane as viewed from above, for two implants in monkey HH (A) and in monkey JB (B). Each circle with a number inside designates one electrode. The fill colors show how electrodes were grouped for analysis, as indicated in the color legends. Those with no fill color were not used owing to defects in placement and/or signal quality. CN electrodes were divided into an anterior group (CNa) and a posterior group (CNp) at AP 19.5 for monkey HH, but not for monkey JB.

