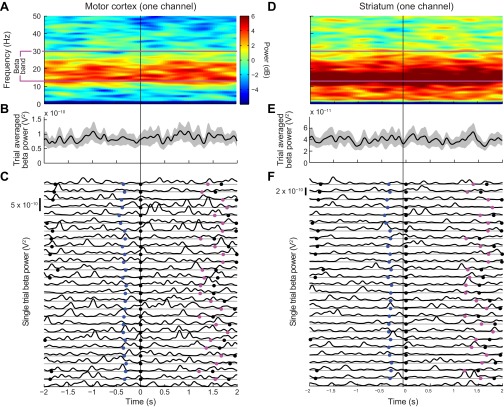
Fig. S6.
Same analyses as in Fig. 2, but for phase-randomized control signals. (A and D) Spectrograms averaged over 27 trials, with power coded as in Fig. 1. (B and E) Time course of average power in the 13–30 Hz pass band (black lines) with 95% confidence limits (gray shading). (C and F) Smoothed power traces for each of the 27 trials.

