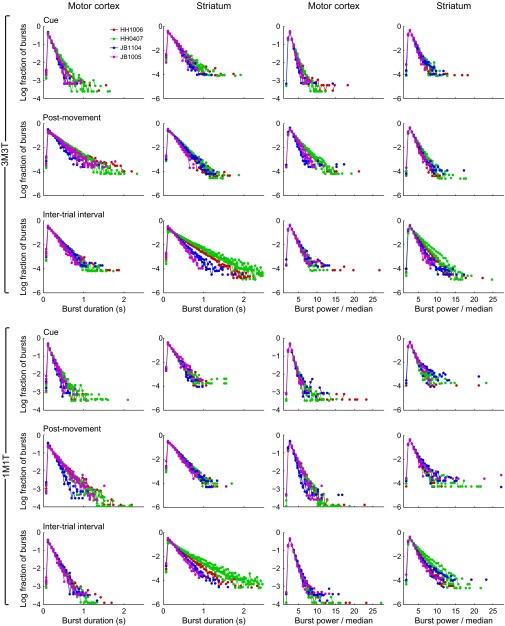
Fig. S9.
Same analyses as in Fig. 6, but broken down by task and by session. Each session is shown as a single curve. Sessions recorded from the same implant share the same color, as indicated in the legend. The first two characters of each implant ID designate the monkey.

