Fig. 1.
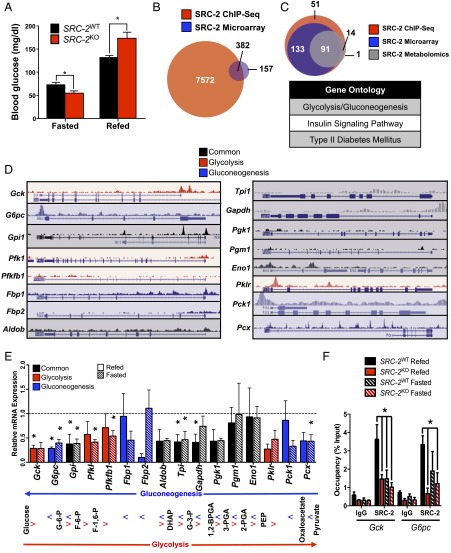
SRC-2 dynamically regulates glycemia via opposing transcriptional programs. (A) Blood glucose (mg/dL) measurements of SRC-2WT and SRC-2KO mice (n = 5 each) after either an overnight fast or an overnight fast followed by a 6 h refeed. (B) Venn diagram representation of integrated hepatic SRC-2 ChIP-Seq binding sites with liver microarray data from SRC-2KO mice. (C) Venn diagram overlap of Kyoto Encyclopedia of Genes and Genomes (KEGG) gene ontologies from liver SRC-2 ChIP-Seq (red), SRC-2KO microarray (blue), and metabolomics data (gray). The top KEGG gene ontologies from the integration of these three ontological sets are listed in the accompanying table. (D) University of California, Santa Cruz (UCSC) genome browser representations of SRC-2 binding sites as determined by ChIP-Seq (7) on common (black) or unique glycolytic (red) or gluconeogenic (blue) gene promoters in wild-type mouse liver. (E) qPCR analysis of common (black) or unique glycolytic (red) or gluconeogenic (blue) genes in livers isolated from SRC-2WT and SRC-2KO mice (n = 5 each) after either a 24 h fast or a 24 h fast followed by a 3 h refeed. Data are represented as relative to wild-type gene expression for each feeding condition, which was set to 1. Accompanying the qPCR data is an outline of glycolysis and gluconeogenesis indicating where each gene product functions in those processes. (F) ChIP-qPCR analysis of SRC-2 occupancy on the gene promoters of Gck and G6pc in SRC-2WT and SRC-2KO mice (n = 3 each) after either a 24 h fast or a 24 h fast followed by a 3 h refeed. ChIP data are represented as a percent of the input, whereas all other data are graphed as the mean ± SEM. *P < 0.05.

