Fig. S1.
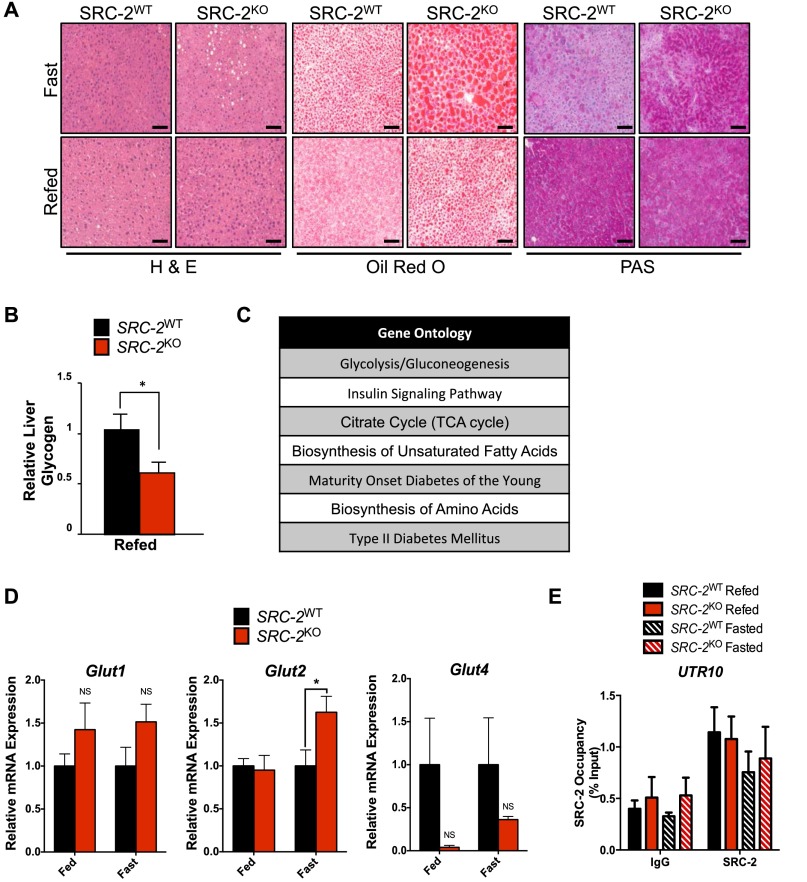
SRC-2 regulates glycemia through transcriptional mechanisms. (A) Representative H&E, Oil Red O, and periodic acid–Schiff (PAS) of SRC-2WT and SRC-2KO fasted for 24 h or 24 h fasting followed by a 3 h refeed. (B) Quantitative measurement of liver glycogen levels in SRC-2WT and SRC-2KO mice (n = 5 each) that were fasted overnight and refed for 6 h. (C) Top KEGG gene ontologies of shared genes between the liver SRC-2 ChIP-Seq and SRC-2KO microarray. (D) qPCR analysis of Glut1, Glut2, and Glut4 in livers isolated from SRC-2WT and SRC-2KO mice (n = 5 each) after either a 24 h fast or a 24 h fast followed by a 3 h refeed. (E) ChIP-qPCR analysis of SRC-2 occupancy on UTR10 in SRC-2WT and SRC-2KO mice (n = 3 each) after either a 24 h fast or a 24 h fast followed by a 3 h refeed. ChIP data are represented as percent of the input, whereas all other data are graphed as the mean ± SEM. *P < 0.05.

