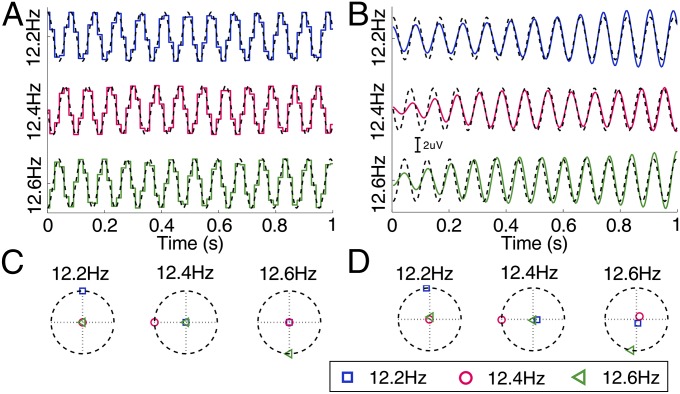
Fig. 2.
Examples of stimulation signals and elicited SSVEPs at 12.2, 12.4, and 12.6 Hz. (A) Temporal waveforms of stimulation signals (solid lines) using the sampled sinusoidal stimulation method (6) based on the monitor’s refresh rate (60 Hz). The dynamic range of the stimulation signal is from 0 to 1, where 0 represents dark and 1 represents the highest luminance. The initial phases of the three frequencies are 0.5π, π, and 1.5π, respectively. The dashed lines indicate the theoretical sinusoidal stimulation signals. (B) Temporal waveforms of average SSVEPs (solid lines) at electrode O1 from one sample subject after applying a time delay of 128 ms to the theoretical stimulation signals (dashed lines). The maximal amplitude of the stimulation signals was set to 3 μV for illustration. A band-pass filter of [11.5 Hz 13.5 Hz] was applied to only retain the fundamental frequency component of the SSVEP signals. The stimulation duration was 5 s in the offline experiment (Materials and Methods). Only the first second of the stimulation signals and SSVEPs is shown in A and B. (C) Complex spectral values for real stimulation signals at the three stimulation frequencies. (D) Complex spectral values for averaged SSVEPs. In each subfigure in C and D, horizontal and vertical axes (dotted lines) indicate the real and imaginary parts of the complex spectral data at each specified frequency (12.2, 12.4, and 12.6 Hz, respectively). Dashed circles indicate spectral values with the maximal amplitude at the specified frequency. The whole 5-s segment was used for calculating the complex spectrum.

