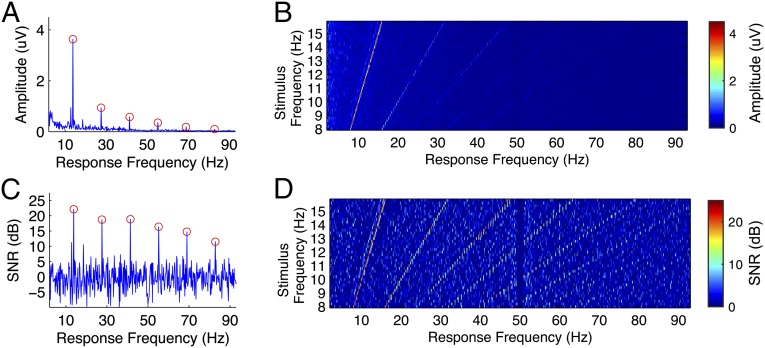
Fig. 3.
Amplitude spectra and SNRs of fundamental and harmonic SSVEP components. Averaged amplitude spectrum of SSVEPs at (A) 13.8 Hz and (B) all stimulation frequencies (8–15.8 Hz) for an example subject (S12). For each stimulation frequency, six trials were first averaged for improving the SNR of SSVEPs. The amplitude spectrum was calculated by fast Fourier transform. The amplitude of spectrum was the mean of all nine channels. Averaged SNR (in decibels) of SSVEPs at (C) 13.8 Hz and (D) all stimulation frequencies (8–15.8 Hz). SNR was defined as the ratio of SSVEP amplitude to the mean value of the 10 neighboring frequencies (i.e., five frequencies on each side). SNR was calculated using the mean amplitude spectrum from A and B. The circles in A and C indicate the fundamental and harmonic frequencies of 13.8 Hz (i.e., 13.8, 27.6, 41.4, 55.2, 69, and 82.8 Hz). In B and D, amplitude spectra and SNRs were depicted as functions of stimulation frequency and response frequency. The frequency interval in the images was 0.2 Hz. The sudden drop at 50 Hz was caused by the notch filter used for removing power line noise in data recording.

