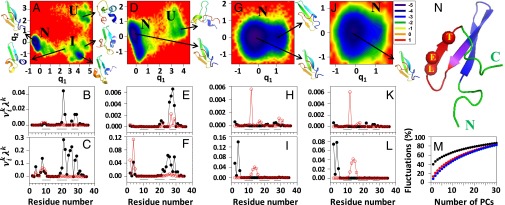
Fig. 1.
FELs (kilocalories per mole) along the first two PCs with representative structures at the minima, and contributions of the principal modes (defined in SI Materials and Methods) [; black lines with black circles (principal mode 1) and red lines with white circles (principal mode 2)] to the MSFs along the θ- and γ-angles for the (A–C) three-state, (D–F) two-state, and (G–I) downhill folding trajectories of L26D and (J–L) the downhill folding trajectory of L26W. The black lines on the bottoms of B, C, E, F, H, I, K, and L correspond to the β-strand regions. I, intermediate; N, native; U, unfolded. M represents percentages of the total fluctuations captured by the PCs for three-state (black line), two-state (red line), and downhill (blue line) trajectories of L26D and the downhill folding trajectory (green line; indistinguishable from the blue line) of L26W. N represents the experimental structure of FBP28, in which the mutated residues are represented by spheres, and hairpins 1 and 2 are represented by blue and red, respectively (the purple region corresponds to the overlap of these hairpins). C, C terminus; E, glutamic acid; L, leucine; N, N terminus; T, threonine.

