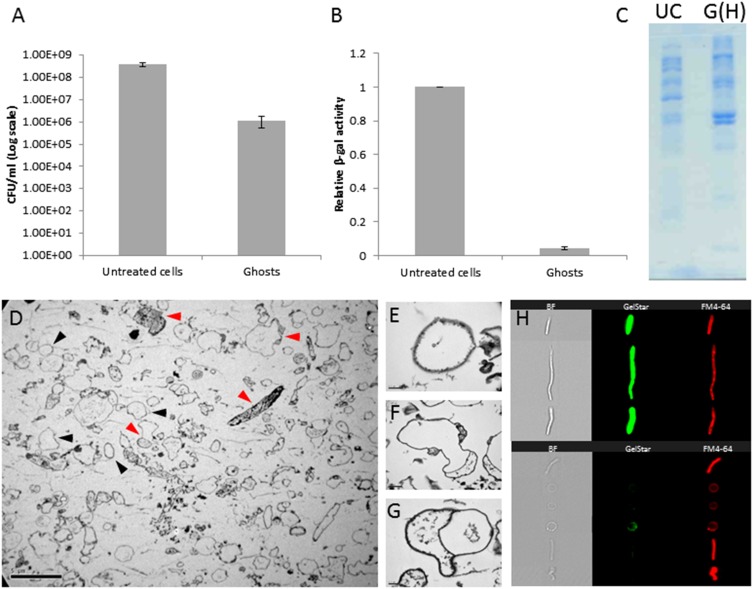
Fig. S3.
Characterization of E. coli AT984 ghosts produced via osmotic shock compared with untreated cells. (A) Viable counts are reduced by two to three orders of magnitude during ghost preparation, while retaining a similar number of cells, as determined with a Neubauer chamber. Values are averages of three independent experiments. Error bars indicate SD. (B) β-Galactosidase activity was used as a proxy to determine the loss of cytoplasmic content. In the ghost treatment, activity decreased by 95.7 ± 0.9%. Values are averages of three independent experiments. Error bars indicate SD. (C) SDS/PAGE protein profile of untreated cells (UC) and ghosts containing Hepes buffer [G(H)] demonstrates a large shift in protein display upon osmotic shock and loss of the cytoplasm. Both lanes were loaded with equal amounts of protein (20 µL of 2.7 mg/mL protein samples). (D) The diversity in ghost shape and content, as captured by TEM. Black arrowheads mark representative ghosts devoid of cytosol, and red arrowheads mark representative ghosts retaining various partial cytosolic contents. (Scale bar, 5 µm.) (E–G) Images of individual ghosts, showing complete (E) and partial (F and G) losses of the cytosol. (Scale bar, 0.2 µm.) (H, Right) Image cytometry (ImageStreamX) visualization of individual elongated E. coli cells before osmotic shock (Upper) and of ghosts (Lower) stained with the nucleic acid dye GelStar and the membrane stain FM4-64. (Left) Bright-field imaging (BF). Compared with intact cells, ghosts exhibit a severe loss of nucleic content (81.1 ± 5.4% of the ghost population had no detectible levels of nucleic acids) and showed a reduction in light refraction).

