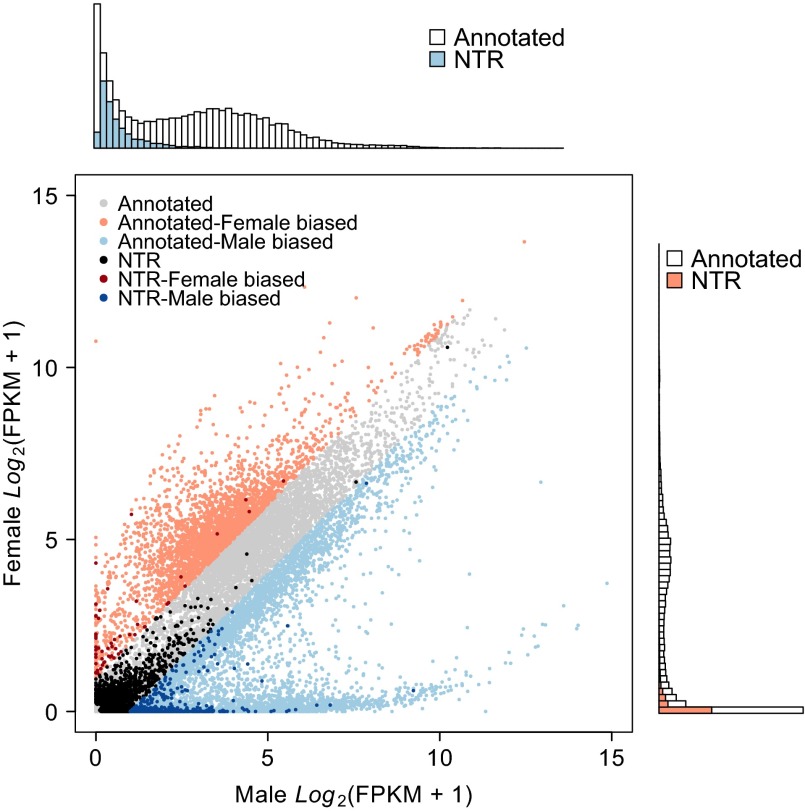
Fig. 1.
RNA-seq in the DGRP reveals many NTRs. The scatter plot compares gene expression of annotated genes and NTRs in females and males. Genes with expression differences of twofold or more between the sexes are considered to have sex-biased expression. The histograms depict the distribution of gene expression in females (Right) and males (Upper), with colored bars (orange, female; blue, male) showing the distributions for NTRs.

