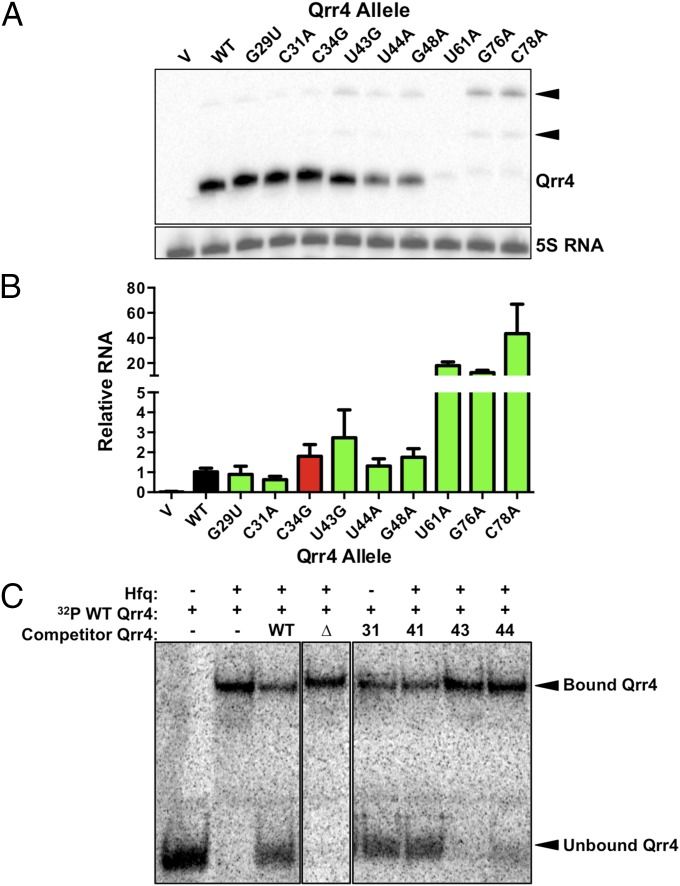
Fig. 4.
Qrr4 mutations can decrease the levels of Qrr4 and its ability to bind Hfq. (A) Representative Northern blot showing WT and mutant Qrr4 levels in E. coli. The WT size band is denoted Qrr4. Larger RNA species are denoted by black triangles. 5S RNA is the loading control. (B) Real-time PCR analysis of WT and mutant Qrr4 levels in V. harveyi at OD600 = 0.1. The black bar shows the relative amount of WT Qrr4. Green bars show relative amounts of Qrr4 mutants with impaired repression. The red bar denotes the level of a control Qrr4 mutant that displays WT repression. (C) Representative native gel showing unbound Qrr4 and Qrr4 bound to Hfq. The Δ represents Qrr4Δ68-115, a non-Hfq-binding control; 31 represents Qrr4-C31A; 41 represents Qrr4-U41A; 43 represents Qrr4-U43G; and 44 represents Qrr4-U44A.

